
The Semantic Modeling Loop
Ju Data Engineering Weekly - Ep 89


Bonjour!
I'm Julien, freelance data engineer based in Geneva 🇨🇭.
Every week, I research and share ideas about the data engineering craft.
Not subscribed yet?
In the last episode of this Boring Semantic Layer mini-series, I wrote a lot about the tool from a consumer’s perspective.
Today, we welcome Benoit Pimpaud to the newsletter for a co-written post, where we approach the semantic layer not just as a consumption-only interface, but as a back-and-forth between modeling and consuming.
John is a data analyst at a SaaS company called Monotone Labs.
It’s finally summertime, and for once, John has a bit of breathing room.
No urgent requests, no last-minute marketing campaigns.
Just time to step back and maybe look at the bigger picture.
After a long sunny lunch break, John returns to his desk around 1:00 p.m., slightly sweaty in his button-up shirt.

He sits down, opens his laptop, and stares at the now-familiar AI chat interface — blank, blinking, waiting.
Then he remembers something a friend told him over drinks last week:
“I tested this open-source semantic layer tool on our sales data — works great with Claude.
You should give it a try.”
It clicks.
He hasn’t looked at sales volume since the last product launch a few months ago — maybe now’s the time.
Alright. Let’s see what this thing can do.
He opens his Claude Desktop settings and adds a new MCP config:
{
  "mcpServers": {
    "cohort_sm": {
      "command": "uv",
      "args": [
        "run",
        "https://raw.githubusercontent.com/boringdata/boring-semantic-layer/refs/heads/main/examples/example_mcp_cohort.py"
    ]
    }
  }
}
PS for reader: yes you can try as well :)
Boom — semantic layer connected.
No install. No setup.
Just Claude talking to a clean interface over John’s order data.
He types his first prompt:
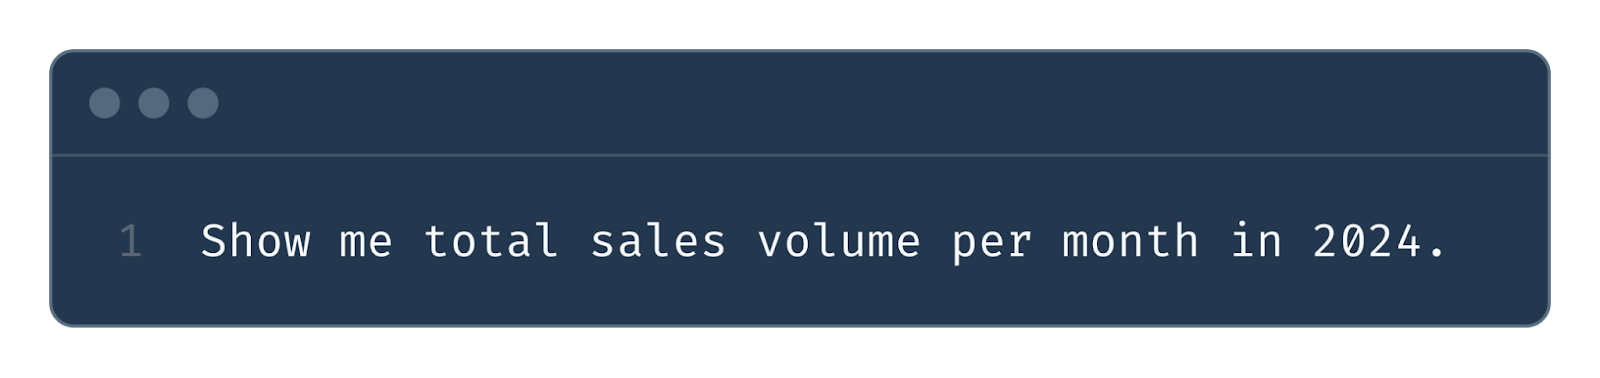
🧠 Claude thinks… calls the right tools… queries the model…
And just like that — charts. Numbers. A real trend.
Not bad for a lazy Friday.
But John’s not done yet.
He wants to break this down by customer segment.
He tries:
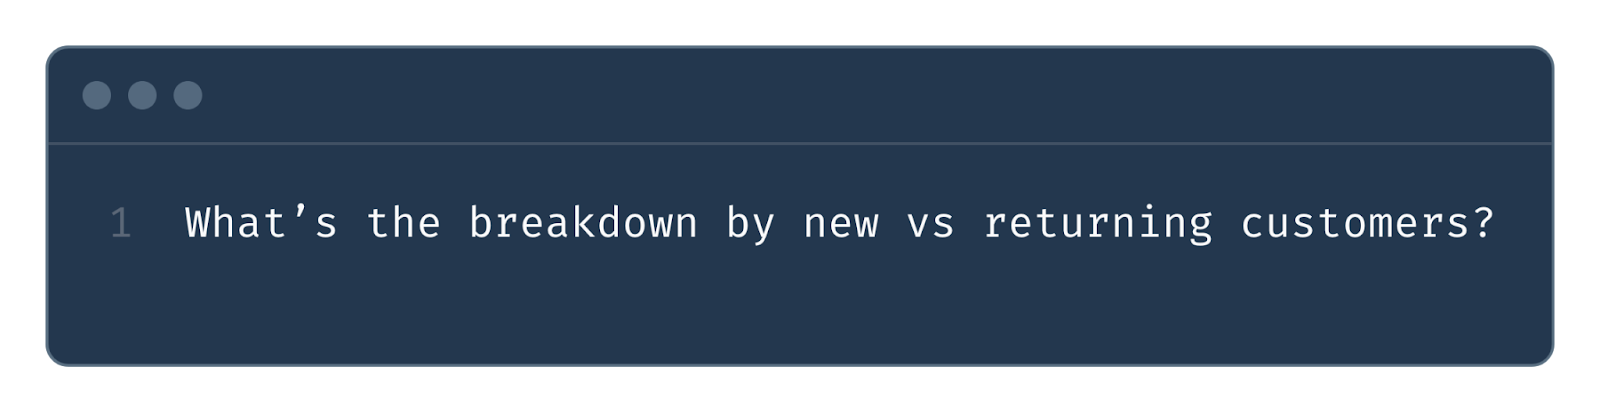
Nothing.
Error.
Turns out the current semantic model doesn’t include customer data.
Of course.
No panic.
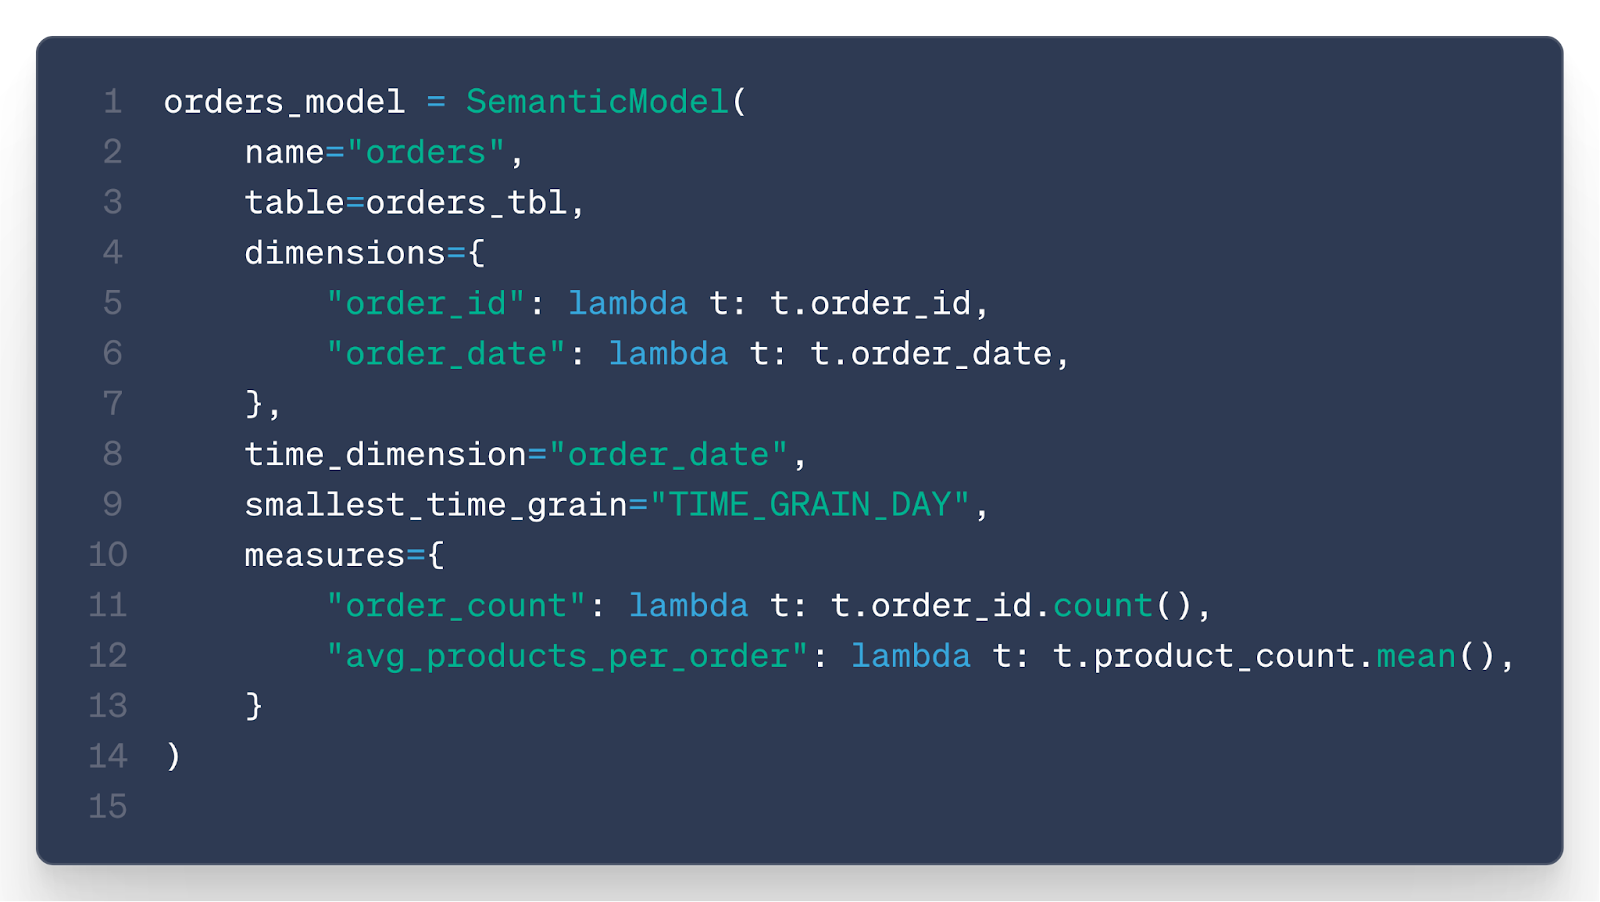
He switches to Cursor, opens the repo, and finds the file that defines the semantic model.
He asks Claude:
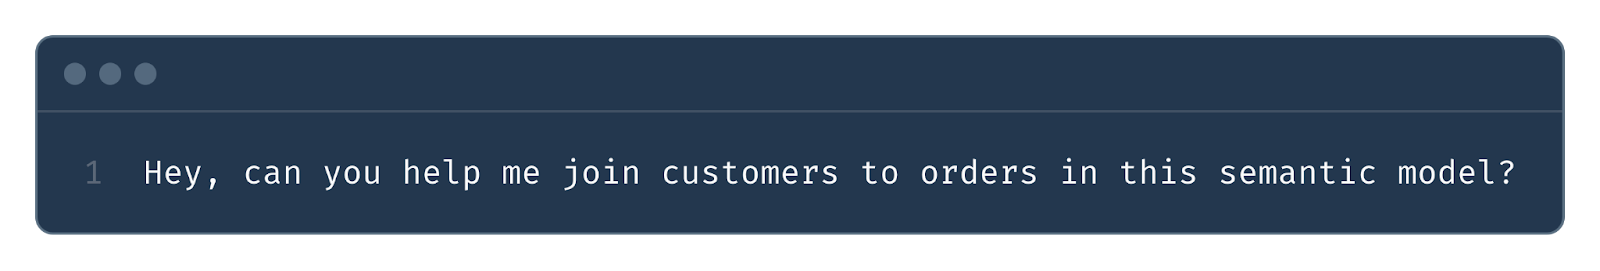
Claude proposes a change.
He reviews the code — makes sense.

He validates and reloads the model.
Now Claude can safely access customer info — no weird joins, no hallucinations.
While he’s at it, John figures: why not ask THE crazy question?

(Yes John does not like sentences…)
John leans back.

He didn’t write a single SQL query.
He didn’t click a single dashboard filter.
Just natural language, a semantic layer, and a good chat interface.
When One Question Leads to Ten
John stares at the new chart.
It’s clear — there’s a trend worth digging into.
But instead of stopping there, he wonders: “What else could I ask?”
One of the biggest leaps LLMs enable is the ability to ask probing questions — not just answer them.
This is a well-known prompting technique.
By encouraging the model to explore the problem space, it often uncovers angles we wouldn’t think of on our own.
But this isn’t new.
It’s what we do naturally with teammates — in meetings, at coffee machines — exchanging perspectives to deepen understanding and reveal blind spots.
So far, everything John’s done has been analyst-driven:
He asked a question → hit a gap → updated the model → asked again.
But what if he flipped the dynamic?
What if the semantic layer didn’t just respond — but evolved through the conversation itself?
What if the LLM could suggest the next question?
Let’s give it a try:
Start with one question.
The LLM responds — and proposes where to explore next.

A bunch of follow-up questions appear, each pointing to new angles:

John could just say “yes” and hope the model has what it needs to answer them.
But he knows better — the underlying semantics aren’t there yet.
Instead, he asks Claude to help build what’s missing.
John reviews it, tweaks a line or two, and approves.
They co-create the semantic definition together.
Recursive Semantic Model Building
With this experiment, we tried to illustrate how we imagine the future of analytics inside modern organizations:
A human poses an initial question
The AI analyzes and identifies semantic gaps
The AI suggests related questions — the human refines or expands the scope
The semantic layer evolves organically, shaped by real questions
The cycle accelerates, enabling deeper, more sophisticated analysis over time

This feedback loop isn’t just efficient — it solves a deeper, persistent issue in analytics: institutional memory.
In most companies, the same insights are rediscovered over and over because:
Analysts leave
Business context gets lost
Past analyses become buried artifacts
Traditional BI tools fall short here — they preserve results, but lose the reasoning behind them.
By contrast, a semantic model declared as code becomes a living artifact.
It can be:
Versioned
Audited
Reviewed over time
More importantly, tracking these feedback loops means we don’t just capture what was analyzed —but also why, how, and what questions led there.
That’s the foundation of analytics that learns — and remembers.
In Data We Trust
There are real limitations to this approach — and the biggest one is trust.
Letting an LLM write code to define your semantic layer is risky.
Semantics are inherently human — they reflect how we think about the business and what we care about.
Context engineering and iterative questioning help mitigate that risk — semantics gradually emerge through the conversation.
But still, it’s not foolproof.
When agents write application code, it’s easy to build trust:
If clicking a button produces the desired behavior, you don’t really need to read the code behind it.
But with data, it’s different.
You can’t trust a chart unless you trust the logic that produced it.
And validating that logic is hard — especially when it’s auto-generated.
And yet — we love this chat BI experience.
First, because the LLM guides you — it doesn’t just answer questions, it gives you new ideas to explore.
Secondly, as the interface is generated on the go, you can place yourself at the perfect zoom level.
BI dashboards are static and frozen, overloaded with details and information you can’t act on.
LLMs show you only what you need to see.
Similar to when you zoom in and out on Google Maps.
You’re not stuck staring at a frozen dashboard overloaded with stale KPIs.
You see just enough to make the next decision — and if you want more, just zoom.
That’s the magic: The LLM gives you the map with control over the zoom level …
Thanks for reading
Benoît and Ju
Thanks Benoît for the super insightful collab (as always :) ).

 | A guest post by
|
Hi Julien, this was super interesting!
I wonder how this could scale. Right now, the one data analyst in your post can handle everything; the iteration makes total sense.
How could this scale to a company where 1) there is a data/analytics engineer taking care of the semantic layer 2) a data analyst fetching the data 3) a business user who has input on the customer segments? I think figuring this out will be the biggest challenge. I'll keep thinking about it :)
Inspiring post - the world is changing as we speak!